

What You’ll Build
A small FastAPI service plus a browser UI, running side by side on your machine. Three short candidate profiles are remembered into an isolated dataset, and the knowledge graph built from them is drawn in the left panel with node size and edge thickness scaled by each element’sfeedback_weight. In the right panel you ask questions in one session, rate the answers 1–5, and then run the feedback memify pipeline — which reads the session’s rated Q&A entries, updates the feedback_weight of the graph nodes and edges those answers used, and hands back a before/after snapshot with a per-element delta. The graph redraws from the “after” side, so a rating you gave a moment ago is visible as a node that grew or shrank.
The complete runnable demo is
examples/demos/sessions/session_feedback_lifecycle_demo/ —
this page walks through the key moments of its backend rather than reproducing it.
Features in Play
- Remember — loads the bundled candidate profiles into the demo dataset in one call
- Recall — answers every question with
GRAPH_COMPLETIONagainst that dataset, inside the demo session - Persistent Memory Across Sessions — the shared
session_idthat makes every question, answer, and rating part of one conversation - Feedback System —
cognee.session.add_feedbackattaches a 1–5 score and a comment to a specificqa_id - Session-Context Guidance — with
AUTO_FEEDBACKon, a rating typed as an ordinary chat message can land on the previous answer without an explicit API call - Improve — the feedback-weight pass, which this demo triggers directly as a memify pipeline so it can snapshot the graph on either side of it
How It Looks
The interface in these screenshots is not the Cognee UI — it is a small frontend bundled with this demo (
frontend/ in the demo folder), built only to make the feedback loop visible. Beyond the logo, it shares nothing with the Cognee UI.How This Demo Works button reopens the panel any time.
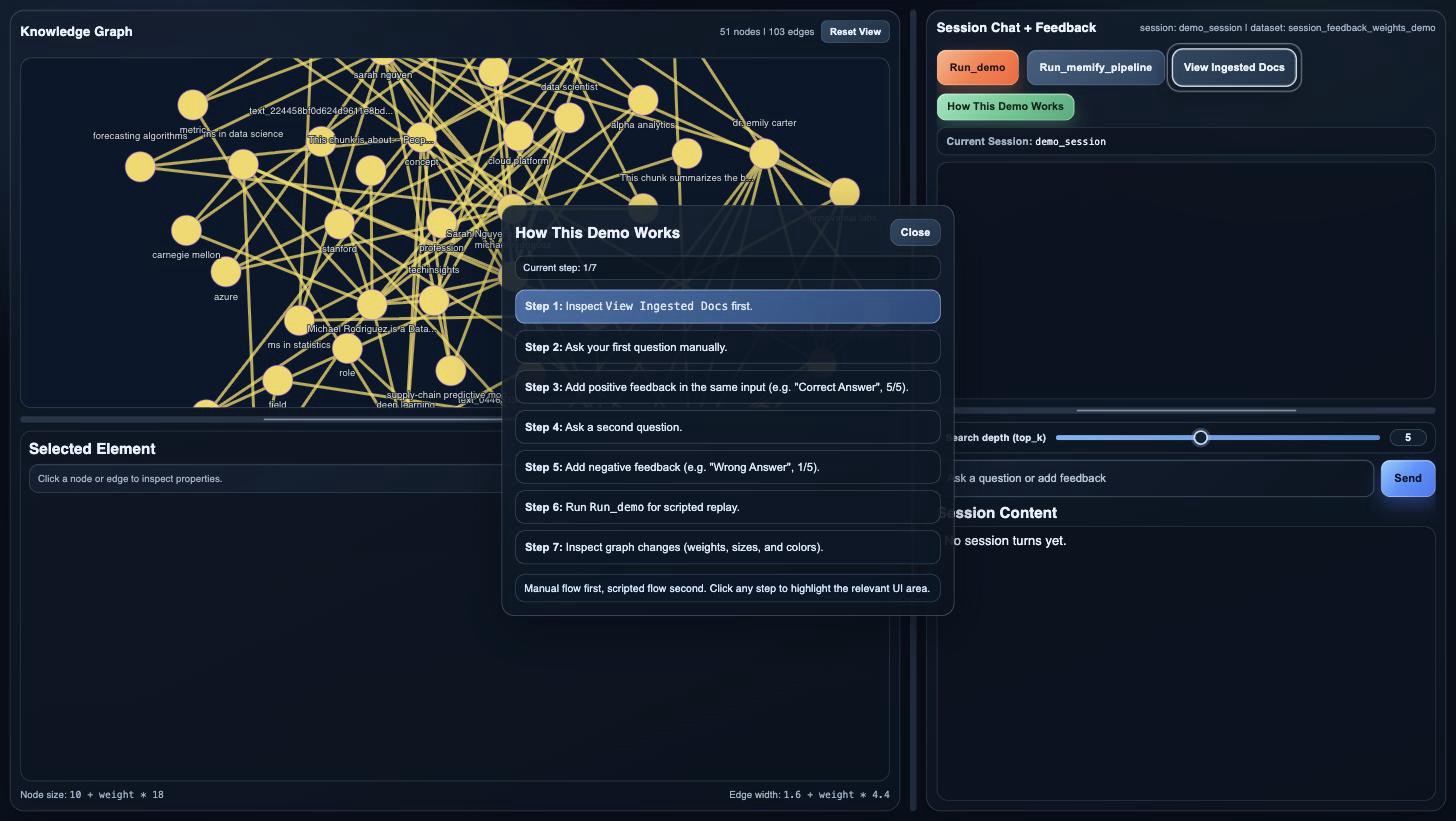
First launch: the walkthrough panel over a freshly built graph, every element still at the neutral weight of 0.5 (node and edge counts vary run to run).
Reset View re-centers the layout; the legend at the bottom states the scaling formulas — node size is 10 + weight * 18, edge width 1.6 + weight * 4.4, and color follows the same signal — which is why an untouched graph draws uniform and a memify run is a visible change rather than a number: praised regions grow and turn green, criticized ones shrink toward red. Clicking any node or edge fills the Selected Element panel below with its properties, feedback_weight included.
The right panel is the session. Across the top sit the four controls: Run_demo (the scripted replay), Run_memify_pipeline (fold the session’s ratings into the graph and redraw), View Ingested Docs, and How This Demo Works. Below them, the current session_id badge, the chat itself, the Search depth (top_k) slider that sets top_k for the next question, and a single input that takes both questions and feedback — type “Wrong answer, 1/5” as an ordinary message and AUTO_FEEDBACK attaches it to the previous answer. Session Content at the bottom lists the session’s Q&A entries with the scores they have accumulated.
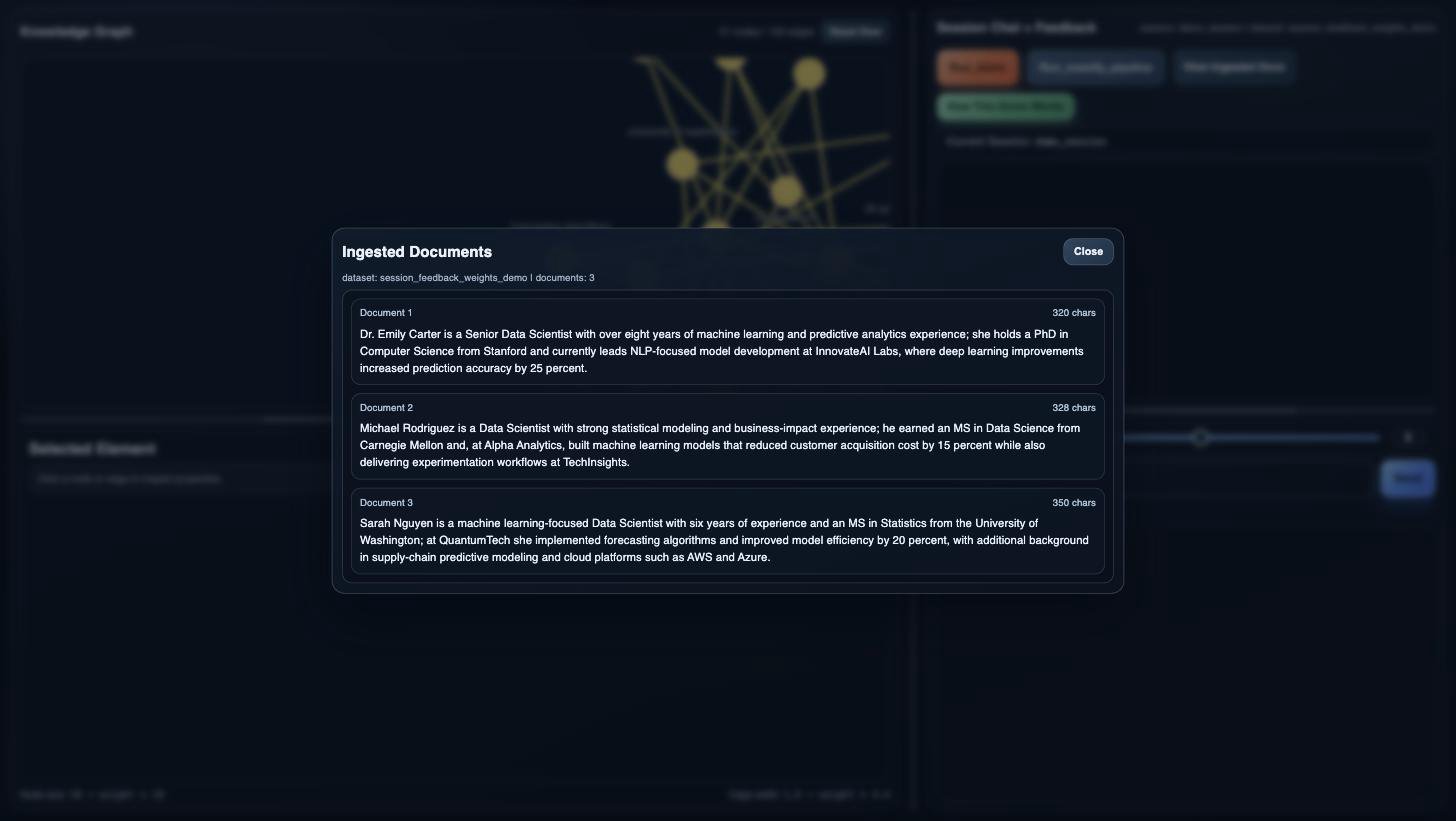
View Ingested Docs is the answer to “what can I ask?” — the dataset is exactly these three candidate profiles.
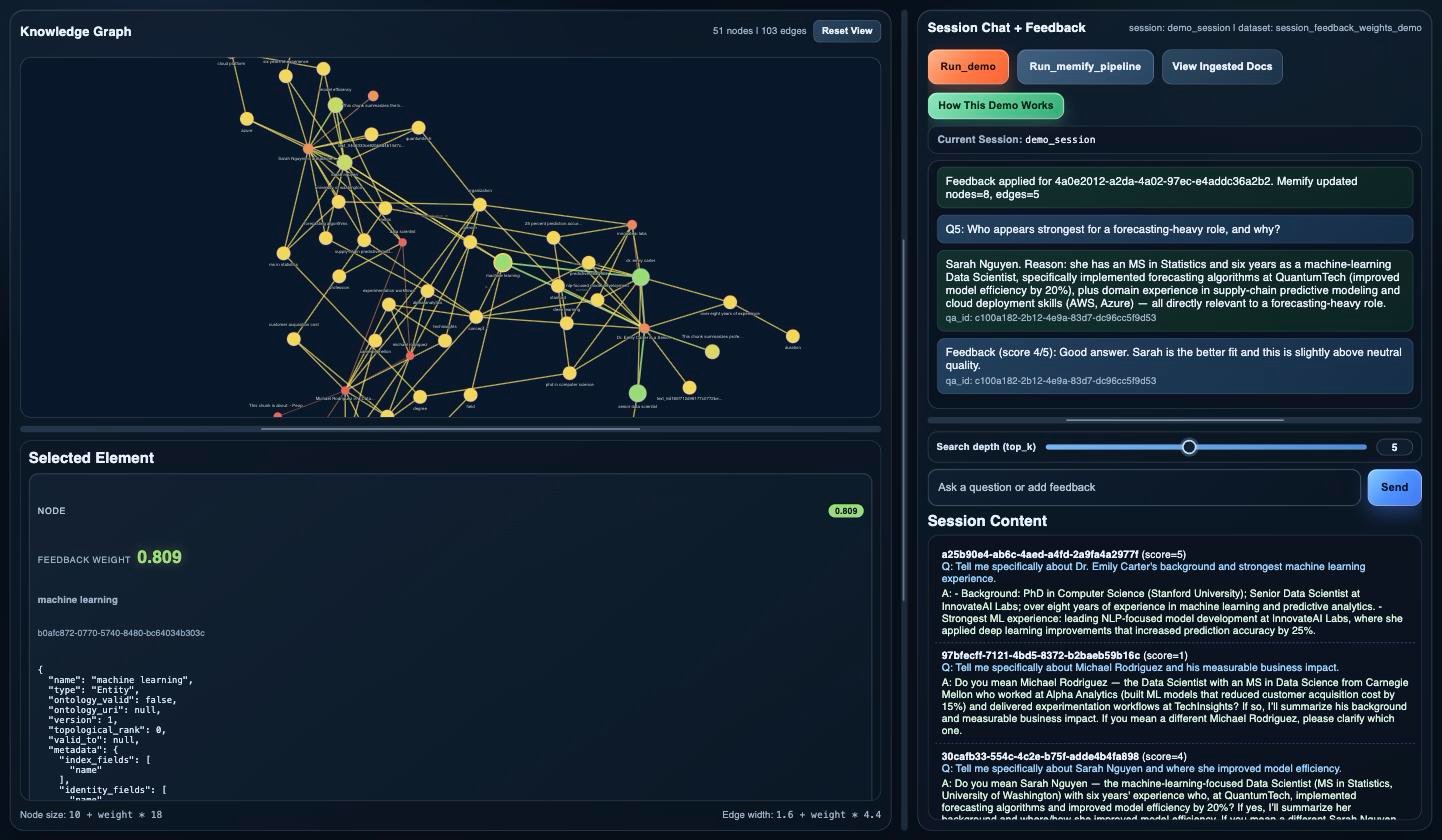
After a few rated turns and their memify passes: praised regions have grown and turned green, criticized ones have shrunk toward red, and the selected node's feedback_weight reads 0.809 — up from the neutral 0.5.
Before You Start
- Complete Quickstart to understand basic operations
- Ensure you have LLM Providers configured — ingestion and every answer are live calls, so wording varies by model
- Run it from a checkout of the cognee repo: the backend serves
frontend/as static assets and readsdata/demo_documents.jsonanddata/scripted_flow.jsonfrom the demo folder, so a copy-pasted single file will not work - Leave the session settings the app expects in place: it pins
CACHING=true,AUTO_FEEDBACK=true, andCACHE_BACKEND=fswithos.environ.setdefault, so a conflicting value already exported in your shell or.envwins and the app refuses to initialize with a412naming the mismatch. See Sessions and Caching for what those control - Expect it to write its storage inside the demo folder —
.data_storage/and.cognee_system/— and to start by callingcognee.forget(everything=True)against those roots, so it clears its own demo storage rather than memory you want to keep - Open the UI in a browser with network access: the page loads D3 from a CDN to draw the graph
Run It
http://127.0.0.1:8765 and then waits, so run it in its own terminal and stop it with Ctrl-C. Success is a browser, not a console — open that address and the page calls POST /demo/init, which streams back its activity log as it configures the isolated storage, forgets it, ingests the bundled documents, and reports the node count of the graph it built. From there the terminal only shows request logs; the demo’s own narration is the activity log in the UI, which records each question with its top_k, each answer, any auto-detected feedback with the score and text it found, each manual rating with its qa_id, and — after a memify run — how many nodes and edges changed weight.
How It Works
Stage 1: Pin the Session Feedback Settings
Source:examples/demos/sessions/session_feedback_lifecycle_demo/backend/app.py
import cognee, which is what makes them take effect. CACHING and AUTO_FEEDBACK are already the defaults, so this pins them rather than enabling them; CACHE_BACKEND=fs is the real departure, putting the session cache in files. The same three names are re-read from the environment when the app initializes — the UI checks GET /demo/config_gate at page load, and POST /demo/init refuses with a 412 naming the mismatch — so if one of them was set to something else before the process started, the demo tells you which one instead of half-working.
Stage 2: Reset Storage and Ingest the Candidate Profiles
Source:examples/demos/sessions/session_feedback_lifecycle_demo/backend/app.py
POST /demo/init is what the UI calls on load. It points cognee’s data and system roots at folders inside the demo, wipes them, and ingests the bundled profiles of Emily Carter, Michael Rodriguez, and Sarah Nguyen. self_improvement=False keeps the automatic improve() run out of the way, so the only thing that will ever change a feedback_weight in this demo is the feedback you give. Each step is appended to an activity log the frontend renders as it goes.
Stage 3: Answer Every Question in One Session
Source:examples/demos/sessions/session_feedback_lifecycle_demo/backend/app.py
query_type to GRAPH_COMPLETION keeps answers on the graph path rather than letting the router pick, which is what makes the graph the thing under test; passing session_id is what records the question and its answer as a rateable Q&A entry. top_k comes from the slider in the UI and is clamped to 1–10.
Stage 4: Catch Feedback Typed Into the Chat
Source:examples/demos/sessions/session_feedback_lifecycle_demo/backend/app.py
POST /demo/send reads the session’s latest entry before and after the search and compares the two. A new qa_id means the message was a question; the same qa_id with changed feedback fields means AUTO_FEEDBACK read the message as a comment on the previous answer and attached it there. That is the branch behind typing “Wrong answer, 1/5” into the chat box: no feedback API is called, and the rating still lands on the right Q&A entry.
Stage 5: Attach an Explicit Score to a Q&A
Source:examples/demos/sessions/session_feedback_lifecycle_demo/backend/app.py
POST /demo/feedback is the explicit path the UI uses when you rate a specific message rather than talking to it. add_feedback returns False only when the qa_id does not exist or caching is disabled, which the endpoint turns into a 404 — a rating that silently failed would be indistinguishable from a rating that moved no weights. An unreachable cache is not a False: it raises out of the endpoint instead, per the feedback return contract.
Stage 6: Read Feedback Weights Off the Graph
Source:examples/demos/sessions/session_feedback_lifecycle_demo/backend/app.py
_snapshot_graph is how the demo sees anything at all: it pulls the whole graph from the engine, then asks the engine for the current feedback_weight of every node and every identifiable edge. Weights are clamped to 0.0–1.0 with 0.5 as the neutral default, so an untouched graph draws as uniform and any variation you see is feedback.
Stage 7: Fold the Session’s Ratings Into the Graph
Source:examples/demos/sessions/session_feedback_lifecycle_demo/backend/app.py
improve() performs with session_ids, called directly here so the demo can bracket it with snapshots. alpha is the smoothing factor for that update, fixed at 0.619 in this demo, and run_in_background=False makes the request wait so the response can carry a real “after”. _compute_deltas diffs the two snapshots and reports every element whose weight moved, which is what the UI highlights.
Stage 8: Replay the Whole Loop From a Script
Source:examples/demos/sessions/session_feedback_lifecycle_demo/backend/app.py
POST /demo/run_demo walks the six question-and-rating turns in data/scripted_flow.json — high marks for the answers about Emily Carter and Sarah Nguyen, 1 for the two Michael Rodriguez turns — asking each question, rating the entry it produced, and then running the same memify pipeline once at the end. The UI’s replay button drives the same six turns a different way: it loops client-side through /demo/send, /demo/feedback, and /demo/run_memify_pipeline, so in the browser the weights shift after every rating rather than once at the end. Either way, it is the fast way to get a graph with visibly uneven weights before you start asking your own questions.
Feedback System
Recording and clearing feedback on session Q&A entries.
Improve
The operation that turns session feedback into graph weights.
Persistent Memory Across Sessions
Working with
session_id for conversational memory.Learn a User's Preferences From Conversation Alone
The sibling demo, where the conversation itself is the feedback.